STX Analysis: Bears Rule STX Market After Bulls Take a Breather
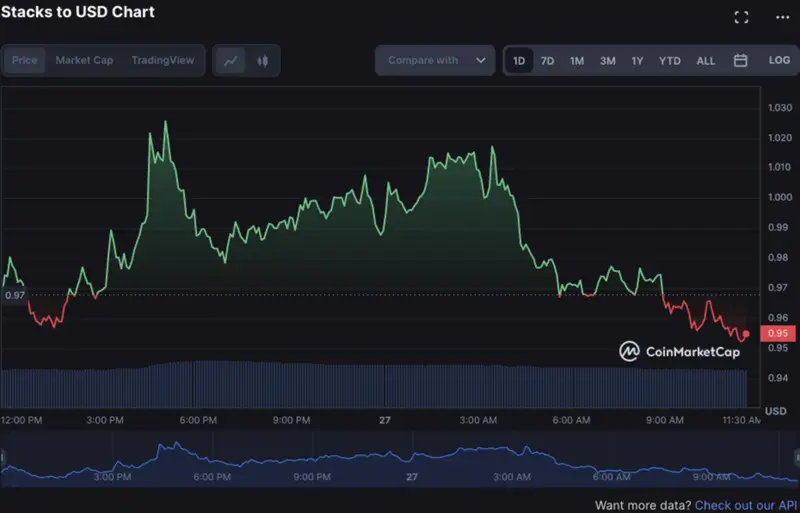
The latest Stacks price Analysis reveals that the bears have a dominant hold over the STX market after a brief surge by the bulls. The STX/USD pair is trading at $0.9522 as of this writing and is trending downward, with a decrease of 2.57% in the past 24 hours. The selling pressure is likely to continue as the bears come back into play.

The STX/USD pair has support present at the $0.9511 area, and a break below this level could push the prices towards lower levels of $0.9459, $0.9375, and even lower prices in the coming days. If buyers manage to hold the $0.9511 level, then there is a possibility of a recovery in prices, and STX/USD could rise toward the next resistance level of $1.03, which is likely to be the target for bulls in the near term.
In the past 24 hours, the STX market has seen a decrease in both volume and liquidity. The total 24-hour trading volume for Stacks stands at $199 million, which is significantly lower by 4.33% as compared to the previous 24 hours. This could signal a lack of buying pressure from investors and traders, which could result in further price declines. The market capitalization of Stacks has also dropped to $1.3 billion, with a drop of 0.79% over the same period.

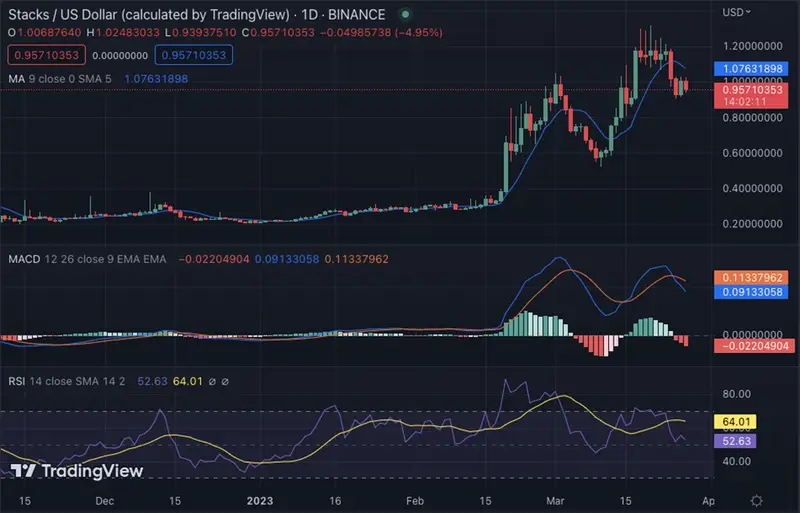
The daily technical indicators are mostly pointing to the bearish sentiment in the market. The moving average indicator is currently at $1.07 and is sloping downward. The Relative Strength Index (RSI) has dipped and currently stands at 52.63, indicating that the bears are in control of the market momentum. The moving average convergence and divergence (MACD) line has also crossed below the signal line, indicating a bearish crossover.
The hourly chart for STX/USD shows that bearish pressure is currently dominating the market. Today’s market opened trading with bullish sentiment, with prices rising from $0.94 to a high of $1.04. However, the bears have since taken control and pushed the STX/USD pair back below the psychological level of $0.95. The sellers and buyers will have to engage in a tussle around the $0.9511 support if any recovery is to be seen in STX coin prices in the near term.

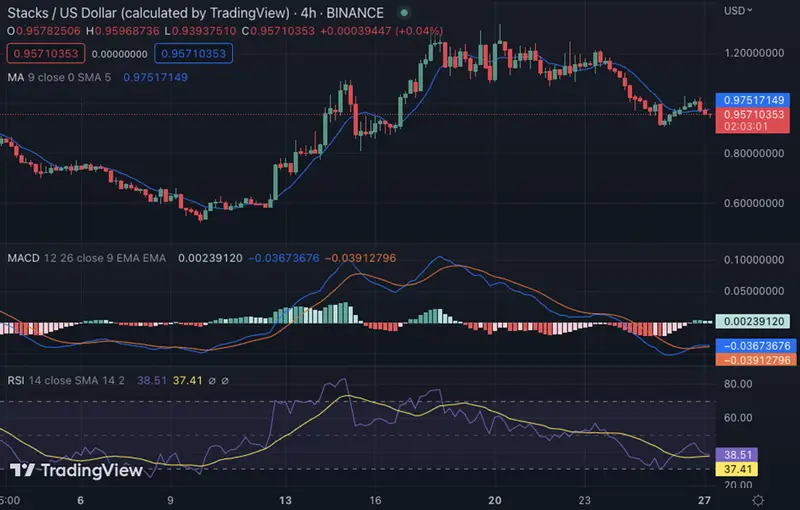
The moving average indicator on the 4-hour chart has also dropped to $0.975 and is trending downward, while the RSI indicator is currently at 38.51, which is still in neutral territory. However, if bears continue to dominate the market, then the RSI will move further into oversold territory. The MACD indicator is also in a bearish crossover as the histogram is trending downward with red bars.
Overall, short-term bearish sentiment dominates the STX market, and prices are likely to remain under pressure in the coming hours. The support at $0.9511 could be the key level to watch for any potential upside, and a break below this level could push STX coin prices toward lower levels. The technical indicators are currently signaling bearishness in the market, but there is still room for recovery if buyers manage to hold on to the support level.
Disclaimer: The views and opinions, as well as all the information shared in this price Analysis, are published in good faith. Readers must do their own research and due diligence. Any action taken by the reader is strictly at their own risk, Coin Edition and its affiliates will not be held liable for any direct or indirect damage or loss.
Comments
Post a Comment